In 1993, the Society of Women Engineers published findings from a survey of a random sample of more than half a million American engineers. Volunteer-driven, A National Survey of Women and Men Engineers: A Study of the Members of 22 Engineering Societies1 (SWE Report) was groundbreaking in its focus on the gendered experiences of working engineers. As we celebrate SWE’s 70th anniversary, we take this moment to reflect on the progress made since the report’s release almost 30 years ago and highlight the challenges we must still address in our efforts to diversify the engineering workforce.
As we contemplate the responses from the 1993 study, we find that today’s women engineers are often still experiencing similar struggles and motivations. We focus on four aspects of the 1993’s report findings: education, workforce attrition, the pay gap, and career advancement. Each section below considers the responses from the 1993 survey against what current research indicates men and women are experiencing today. Much of the research referenced in this article was included in SWE’s most recent literature review, an annual offering that SWE has provided to its members since 2001.
Education
One of the most crucial components of achieving gender parity in engineering is education. One may say that education breeds a talent pipeline for future engineers. Comparing the educational attainment of engineers who participated in the 1993 study versus engineers in the workforce today, we observe that the trend of increasing levels of degree completion among women in the U.S. is reflected in one aspect among engineers: women’s advanced degree attainment.

Sources: Society of Women Engineers. (1993). A National Survey of Women and Men Engineers: A Study of the Members of 22 Engineering Societies; National Science Foundation, National Center for Science and Engineering Statistics, Women, Minorities, and Persons with Disabilities in Science and Engineering, Table 9-5.
When the 1993 survey was initiated, there had been a large influx of women into the profession. In the early 1970s, less than 1 percent of engineering graduates in the U.S. were women. By the time the survey was completed in 1992, almost 20% of first-year students enrolled in engineering programs were women. As a result, thousands of women entered the engineering workforce between 1970 and 1992.
However, while the percentage of women earning degrees in engineering increased by almost 18% in that 20-year period, the representation of women in engineering degrees awarded has hovered around 20% ever since. Data from the National Science Foundation show that more women are obtaining engineering degrees than ever before — approximately 30,000 women earned bachelor’s degrees in engineering in 2017-18 — but this represents only 21% of total engineering degrees awarded.2 Moreover, disproportions in advanced degrees in engineering also persist: Only 26% of master’s degrees earned and 24% of doctoral degrees were earned by women in the 2017-18 academic year.3
While the percentage of degrees awarded to women in engineering has remained relatively stagnant, we have seen an interesting trend among working engineers. Since the 1980s, more women than men are obtaining advanced college degrees, and we find similar attainment differences in engineering: Women engineers tend to hold advanced degrees at higher rates than men engineers. The 1993 data show that this was true for women engineers under 40 years of age, with 27% of women versus 17% of men holding advanced degrees (Table 1). In 2017, 45% of women engineers versus 37% of men engineers held advanced degrees (regardless of age).⁴ It is important to note that many engineers earn degrees outside of engineering, though most possess at least one STEM-related degree.
Workforce attrition
While we have seen an increasing number of women entering the engineering workforce, gender inequalities still pervade the engineering workplace.
When reviewing the findings of the 1993 survey, we theorize that the increase in undergraduate enrollment of women into engineering programs in the prior years could partially explain a few of the survey’s findings regarding the workplace. First, the mean age of men who responded to the survey was almost nine years more than that of women (43 years old versus 34 years old, respectively).⁵ While the SWE Report authors noted that a bias against younger engineers might be present in their findings, the bias was considered minor. In looking at more recent data regarding the age difference between genders in the engineering workforce, the gap is still present, though the gap has narrowed. The average age of men engineers is 44 years old, while women engineers’ average age is 39 years old.6 Generational differences and efforts to diversify the workplace likely add additional layers of complexity to the issues facing women in the engineering workplace. Indeed, a closer look at anecdotal experiences and other forms of data — both within the SWE Report and today — suggests that there could be social factors at play. For example, the SWE Report mentions one man commenting on the survey about his belief that women and people of color were favored over white males in hiring decisions.⁷ Such views can (and do) negatively impact the working environment in engineering and make it difficult for women to feel a sense of belonging.

In the 1993 SWE Report, the authors noted that women appeared more likely than men to retire at an earlier age.8 Research shows that there is still an issue with retention of women in engineering, and the reasons for their departures vary. Fewer women than men who earn an engineering degree end up working in the engineering profession, and more women than men leave the profession over time. In other words, not only do men engineers outnumber women engineers in early career, but in later career the gender gap is even wider. A 2012 study of why women leave engineering found that 10% of women who had earned engineering degrees chose not to practice, and another 20% of women left the profession because of workplace climate and culture.9
A recent study conducted by Tao and McNeely examined the retention of graduates between 1993 and 2013 in the engineering workforce. They discovered that only 59% of graduates were still working in engineering occupations, and persistence rates were lower for women than for men.10 The researchers also found that women of color, particularly African American and Asian American women, were less likely to stay in the profession than their male counterparts. Not only is this level of attrition concerning due to our need to increase our STEM talent, but high numbers of women leaving the profession mean fewer women rising into management.
Another area where gender differences were observed was in unemployment rates. Responses from the 1993 survey indicate that the unemployment rate for women in engineering was 3% higher than that of men, and though the researchers noted that the data probably underestimated the proportion of engineers who were unemployed, the gender gap is apparent.11 While gender norms and biases likely played a role, the authors theorized that the industry in which women worked could help explain the higher unemployment rate that they were experiencing. The report pointed out that women respondents were less likely to work in the largest industry sectors, such as consulting and engineering service firms. Instead, they were more likely to work in manufacturing, which tends to be more vulnerable to economic change.
Still, about one-third of unemployed women reported that their reasons for unemployment were due to domestic duties, such as child care and spousal transfers. However, not a single male respondent reported such obligations as a reason for leaving work — despite the authors’ observations that men were more likely to be currently married than women (81% to 61%, respectively) and more likely to have children. Such observations indicate that not only was the duty of child care more likely to be assumed by women, but that women were more likely to be put in a position of having to choose between career and family.
A recent study conducted by Cech and Blair-Loy found that women in STEM still face work/family tensions that can lead to employment departures.12 Researchers discovered that both men and women often leave full-time STEM employment after the birth of their first child, switching to part-time work, leaving STEM, or leaving the labor force altogether, but women were considerably more likely to do so (43% vs. 23%, respectively). In other words, having a family is still a strong factor in women’s decisions to leave engineering.
Gender disparities rooted in social norms are still pervasive and can impact the sense of job security and perceived worthiness in the workforce. A recent study of the oil and gas industry provides an example of how, despite official policies surrounding measurement of performance, management and decision-makers may still veer toward making major staff decisions based on perceived gender roles.13 The researcher discovered that women and other social groups were often laid off in lieu of what managers perceived to be as more “deserving professionals”; typically, white males who were the primary family breadwinner. Unfortunately, this bias pattern often presents itself in times of economic uncertainty. Most recently, researchers have observed a similar “motherhood penalty” and “fatherhood premium” during the COVID-19 pandemic, with data from the Bureau of Labor Statistics showing that employers were less likely to lay off fathers following the pandemic outbreak earlier this year.14 Based on these findings, it seems that having a family has the opposite impact in the workplace for men than for women. Employers are deterred from laying off men with families, whereas women striving to balance family and work life are less likely to be considered “deserving professionals” or primary breadwinners.
The pay gap
The gender disparities highlighted in the 1993 study do not end with differences in workforce attrition. Report authors also found that, while starting salaries for men and women were similar, the gender pay difference increased over time (Figure 1). They noted that data from that period indicated that recruitment offers made to engineering graduates were similar for men and women, but that by the time engineers enter their 30s, men start earning more and continued to stay ahead of women in earnings for the rest of their careers.15

The gender pay gap is still affecting women in engineering today. The most recent data available indicate that, unlike the findings from the 1993 survey that found that women engineers over 50 were earning only 83% of what men engineers were earning, the gap remains relatively steady over time. In their 20s, men engineers earn about 3% more than women engineers, and that gap grows to 5-7% as engineers age (Figure 1).
Census data show that the salary gap between men and women in engineering varies by discipline and degree level, with women earning between 5% to 14% less than men, depending upon the area of specialization (Figure 2). The fact that, on average, women are younger than men in the engineering workforce could explain some of the pay gap, but as illustrated earlier, it does not explain all. Race/ethnicity is also a factor, with women engineers of color earning less than men and white women engineers.16
Career advancement
Survey respondents from the 1993 study indicated that women were less likely to participate in management. The findings show that 51% of men “feel like they are part of management” compared with only 31% of women. Researchers noted that this difference persisted across all ages, regardless of the size of employer.17 When asked about degrees of separation between respondent and CEO, women described the C-suite as “the glass ceiling in management.”18
With only 7% of Fortune 500 CEOs being women today, little has changed in the gender diversity in leadership since the study was conducted.19 However, research points to challenges that women face in midlevel management that may be preventing them from being considered for executive positions. A 2019 report by McKinsey & Company referenced a phenomenon they called the “Broken Rung,” where the challenges with gender parity within the C-suite are less of a glass ceiling and more of a broken rung in a ladder preventing women from getting to midlevel management positions that will set them up for the executive suite.20 While this is an apt metaphor for what many women report experiencing in the workplace, multiple faulty rungs exist throughout the education and workforce pathways for women in engineering.
Gender bias and discrimination factor into the challenges women face in career advancement. Research indicates that only 38% of women in male-dominated STEM workplaces believe they are treated fairly when it comes to opportunities for promotion and advancement.21 SWE’s research on gender bias found that women engineers often feel that they are not given the advancement opportunities they deserve, and many feel they do not have the same access to formal and informal networks as their male colleagues.22
Conclusion
Our analysis of the findings from SWE’s 1993 survey and more recent data and research available on engineers uncovers a number of interesting observations about the changes that have taken place over the last 30 years. While more women continue to earn degrees in engineering, and more women engineers are obtaining advanced degrees than men, we continue to see the influence of gender bias and discrimination in women’s attrition rates, career advancement, and pay.
Interestingly, despite the gender gaps in pay, in the 1993 study women reported being more satisfied with benefits and pay than men. Similarly, a recent SWE survey of women engineers found that more than 70% were satisfied with their salaries.23 The pay gap does not appear to be a driving factor in women’s decisions to leave engineering. The issues that influence women’s decisions to leave appear to center on a lack of opportunities for career advancement and policies affecting work/family balance. Women continue to be seen as less deserving of professional opportunities — including most recently being on the short end of the stick when it comes to the “fatherhood premium” during our current economic downturn. While it is unclear what the direct employment impact of the pandemic is for women engineers at this time, research points to the continued struggles they are facing in reaching the leadership circle.
These issues are not ones that women can change on their own. The systemic inequities that are permeating the engineering workplace require organizations to hold management accountable to ensure that women are considered fairly for high-profile assignments and leadership programs that will set them up for promotional consideration. A review of existing policies to address work/family balance, to make sure that those policies provide a level of flexibility — particularly during challenging economic times — will help to ease the burden that is so often unequally placed on women in the workforce. SWE’s annual review of the literature began to help researchers and change-makers better understand why these inequities exist, and while we have increased our knowledge about the systemic challenges and obstacles that exist, more research is needed to understand what efforts are most effective at combating these issues.
To learn more about SWE’s 1993 study, please visit SWE’s Research site at https://research.swe.org/category/swe-research/ to download the report.
References
1. For the remainder of the article, this report will be referred to as the “SWE Report.” Download this report to learn more about the sample demographics and detailed findings at https://research.swe.org/category/swe-research/.
2. U.S. Department of Education, Institute of Education Sciences, National Center for Education Statistics, Digest of Education Statistics 2019, Table 325.35.
3. Ibid.
4. National Science Foundation, National Center for Science and Engineering Statistics, Women, Minorities, and Persons with Disabilities in Science and Engineering, Table 9-5.
5. See page 5 of the SWE Report.
6. National Science Foundation, National Center for Science and Engineering Statistics, Scientists and Engineers Statistical Data System (SESTAT), 2013.
7. See page 36 of the SWE Report.
8. See page 6 of the SWE Report.
9. Fouad, N.A., Singh, R., Fitzpatrick, M.E., and Liu, J.P. (2012). Stemming the Tide: Why Women Leave Engineering.
10. Tao, Y. and McNeely, C.L. (2019). Gender and Race Intersectional Effects in the U.S. Engineering Workforce: Who Stays? Who Leaves? International Journal of Gender, Science and Technology 11(1).
11. See page 25 of the SWE Report.
12. Cech, E.A. and Blair-Loy, M. (2019). The Changing Career Trajectories of New Parents in STEM. PNAS 116(10), 4182-4187.
13. Williams, C.L. (2019). The Deserving Professional: Job Insecurity and Gender Inequality in the Oil and Gas Industry. Labour & Industry 29(2), 199-212.
14. Dias, F.A., Chance, J., and Buchanan, A. (2020). The Motherhood Penalty and the Fatherhood Premium in Employment During COVID-19: Evidence from the United States. Research in Social Stratification and Mobility (69).
15. See page 32 of the SWE Report.
16. Pew Research Center, January 2018. “Women and Men in STEM Often at Odds Over Workplace Equity”
17. See page 32 of the SWE Report.
18. See page 36 of the SWE Report.
19. Hinchliffe, E. (May 18, 2020). The Number of Female CEOs in the Fortune 500 hits an all-time record. Fortune. https://fortune.com/2020/05/18/women-ceos-fortune-500-2020/
20. McKinsey & Company. (2019). Women in the Workplace 2019. https://womenintheworkplace.com/
21. Pew Research Center, January 2018. “Women and Men in STEM Often at Odds Over Workplace Equity”
22. Williams, J.C., Li, S., Rincon, R., and Finn, P. (2017). Climate Control: Gender and Racial Bias in Engineering? https://research.swe.org/climate-control/
23. Society of Women Engineers. (2019). Women in Engineering Talent Pulse Report. https://research.swe.org
Reflections on SWE’s 1993 National Survey of Women and Men Engineers
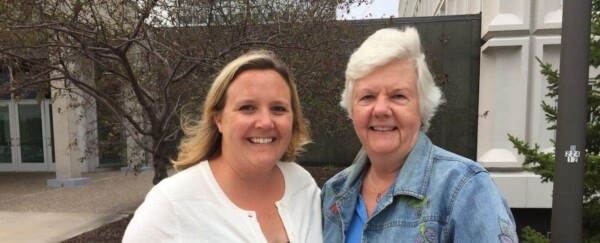
By Peggy Layne, P.E., F.SWE and Patricia L. Eng, P.E., F.SWE

SWE’s 1993 National Survey of Women and Men Engineers actually started in the late 1980s. Times were different then — personal computers were a novelty (Layne’s first computer was an Atari 1040 ST!), the internet was in its infancy (do you remember dial-up modems?), and email was largely restricted to academia. SWE was different, too. With a small headquarters staff mostly devoted to processing membership dues, we were truly a volunteer-run organization. A national survey of women engineers started out as one member’s idea and grew into a project that established SWE as a source of knowledge about women in engineering.
Since its early days, SWE had a statistics committee dedicated to collecting information about women in engineering. In the 1950s, the committee worked with the United States Department of Labor Women’s Bureau to produce Bulletin No. 254, “Employment Opportunities for Women in Professional Engineering.” The committee occasionally produced “Profiles” of women in engineering, with data largely about SWE members.
Patricia Eng, P.E., F.SWE, was a member of SWE’s Chicago Regional Section in the 1980s and wondered whether her experience as an Asian American woman engineer was unusual. When she was recruited to chair the statistics committee, she built on her experience surveying her local section members to develop a broader survey for what was then the Heartland Region (H) of SWE. Eng recalls working with the Engineering Workforce Commission (EWC) of the American Association of Engineering Societies (AAES) on the project:
“Their expert statistician, Dick Ellis, helped me rework our questionnaire from two to six pages with detailed demographics questions. I wanted to know more about women engineers so insisted on adding some attitudinal questions to see how women saw their careers — biggest obstacles and questions on discrimination. Needing a comparison group, I called the National Society of Professional Engineers and asked for mailing labels for NSPE members in SWE’s Region H to make the survey a comparative one — men and women in the same geographic area. Our sample population came from multidisciplined technical societies in an eight-state region. I intentionally oversampled the NSPE members to make sure the survey would be valid. [The region director] provided some funding for the survey, and thanks to the EWC, we received a modest grant from Procter & Gamble so we could pay for the postage. The Minnesota Section helped us fold, stuff, and mail 1,300 surveys to roughly 850 NSPE and over 450 SWE members to get a statistically valid sample. All the paper survey responses came back to my house.
“We got 587 usable responses — a decent return rate and roughly twice the number of women than men. I personally input the data into a dBase III program written by my then boyfriend and did the initial data analysis. Dick Ellis compared the Region H results with other available data on the engineering workforce, and the EWC published Engineering Workforce Bulletin #107 in January 1991, which showed distinct demographic and, for the first time, statistically valid attitudinal differences between women and men engineers. The attitudinal data caused a sensation. Men of all ages consistently cited external factors as their biggest career impediment, while women of all ages consistently cited more personal factors, such as motherhood, not being well enough prepared or having enough training, or discrimination as their biggest impediment. This made big news in the engineering workforce community. This was the first-ever, statistically significant, and valid, comparative survey of women and men engineers. And it ignited interest and enthusiasm for a national effort, which was conducted in 1992 and had sufficient people of color to draw some conclusions on the experiences of Black, Hispanic, and Asian engineers.”
Eng chaired the SWE statistics committee from 1988 to 1991. The national survey was overseen by her successor as statistics chair, Shelley Wolff, P.E., F.SWE, from 1991 to 1993. (Wolff later served as SWE president, from 2001-2002.) Support for nationwide implementation of the survey was provided by Conoco Corporation, the General Electric Foundation, the General Motors Foundation, and the Alfred P. Sloan Foundation. Members of the 22 member societies of the AAES formed the survey population. The survey was conducted by paper mail, with staff of the EWC providing data entry and analysis.
Following publication of the survey report in 1993, Layne became statistics chair and spent FY94 publicizing the survey findings through articles in SWE Magazine and other engineering publications. SWE Magazine highlighted survey findings related to women’s and men’s attitudes toward their engineering educations; opportunities for advancement; and perceptions of equitable treatment, employment sector, and salary. Articles about the survey also appeared in ASEE Prism, ASCE News, Science, and Working Woman. Subsequent analysis of the survey data provided insights on the experiences of Asian American engineers. The data did not include an adequate sample of underrepresented minority engineers for a separate analysis.
We (the authors) gave many presentations, both separately and together, for local SWE sections, SWE region conferences, and meetings of other engineering societies. Note that these presentations were given using overhead transparencies and 35mm slides — no PowerPoint in those days! Eng and Past President F. Suzanne Jenniches, F.SWE, testified before the United States Congress on the findings of the survey and the Society’s position statement in support of the Gender Equity in Education Act.
The collaboration with other engineering societies and the publicity around the survey findings brought significant attention to SWE and to the experiences of women in engineering. Shelley Wolff reflects, “I think one of the good things that came from the survey and report is that it gave SWE a gravitas that it didn’t have before. It showed that we were more than a ‘society.’ We could make significant contributions to the engineering community. I think it elevated our stature in AAES and with other engineering organizations.”
Peggy Layne, P.E., F.SWE, is former assistant provost and director of the ADVANCE program at Virginia Tech. She holds degrees in environmental and water resources engineering and science and technology studies. She is the editor of Women in Engineering: Pioneers and Trailblazers and Women in Engineering: Professional Life (ASCE Press, 2009). A Fellow of the Society of Women Engineers, Layne served as SWE FY97 president.
Patricia L. Eng, P.E., F.SWE, developed SWE’s survey of women and men engineers and served on SWE’s board of directors from 1989 – 1993. Now a retired nuclear engineer, she is a certified ISO KM auditor, has written two books on knowledge management, and enjoys traveling, gardening, and her cat.